FACTORS THAT CAN TRIGGER DEPRESSION
an application of machine learning to national health survey data in brazil
Haydée Maria Correia da Batista[1]
Federal University of Rio de Janeiro
haydee.batista@coc.ufrj.br
Andrea Borges Paim[2]
Federal University of Rio de Janeiro
andrea.borges.paim@gmail.com
Brenda Santos Siqueira[3]
Federal University of Rio de Janeiro
brenda.siqueira@coc.ufrj.br
Nelson Francisco Favilla Ebecken[4]
Federal University of Rio de Janeiro
nelson@ntt.ufrj.br
Ana Claudia Dias[5]
Centro Federal de Educação Tecnológica Celso Suckow da Fonseca – CEFET
missdias@gmail.com
______________________________
Abstract
According to data from the last National Health Survey (PNS), conducted in 2013 by the Brazilian Institute of Geography and Statistics (IBGE) in partnership with the Ministry of Health, 7.6% of people aged 18 and over received diagnosis of depression. Therefore, based on this research, the purpose of this study was to identify factors that may be relevant to a possible diagnosis of depression, using machine learning techniques. The binary logistic regression model was chosen as the machine learning technique, with progressive and regressive methods for selecting variables and a model built by the researcher, generating seven different models. The model’s performance evaluation was made by comparing some metrics such as Cox-Snell R2 and Nagelkerke R2, which presented remarkably close results. Based on these models, 37 explanatory variables were selected which were applied to a new logistic regression model. The results showed that some variables significantly increased the chance of a positive diagnosis of depression as well as some variables were indicative of a reduction in the chances of this diagnosis.
Keywords: Depression. PNS. Machine learning. Logistic regression. Modeling.
FATORES QUE PODEM DESENCADEAR DEPRESSÃO
uma aplicação do aprendizado de máquina aos dados da Pesquisa Nacional de Saúde no Brasil
Resumo
De acordo com os dados da última Pesquisa Nacional de Saúde (PNS), conduzida no ano de 2013 pelo Instituto Brasileiro de Geografia e Estatística (IBGE) em parceria com o Ministério da Saúde, 7,6% das pessoas de 18 anos ou mais receberam diagnóstico de depressão. Portanto, com base nessa pesquisa, a proposta deste estudo foi identificar fatores que possam ser relevantes para um possível diagnóstico de depressão, utilizando técnicas de aprendizado de máquina. Escolheu-se como técnica de aprendizado de máquina o modelo de regressão logística binária, com métodos progressivos e regressivos de seleção de variáveis e um modelo construído pelos pesquisadores, gerando sete modelos diferentes. A avaliação de desempenho dos modelos foi feita através da comparação de algumas métricas como Cox-Snell R2 e Nagelkerke R2, que apresentaram resultados bem próximos. Com base nesses modelos, foram selecionadas 37 variáveis explicativas que foram aplicadas a um novo modelo de regressão logística. Os resultados apontaram que algumas variáveis aumentaram significativamente a chance de um diagnóstico positivo de depressão, bem como algumas variáveis foram indicativas de redução das chances desse diagnóstico.
Palavras-chave: Depressão. PNS. Aprendizado de máquina. Regressão logística. Modelagem.
1 INTRODUCTION
There are many factors that influence the health and quality of life of individuals. Socioeconomic, behavioral, nutritional and health issues can directly affect physical, mental and social well-being. Epidemiological data demonstrate that 50% of the determinants of health status are factors linked to people's lifestyle (KALETA ET AL, 2009). And, among the affective disorders that most affect people and that are taking on huge proportions today, depression, an affective mental disorder that has been considered the “disease of the century”, stands out. Depression is a disease that gradually establishes itself and is not noticeable, being associated with a simple sadness unnoticed for years and that, suddenly, modifies and disrupts the individual's routine (ANDRADE, 2020). Admittedly a public health problem, depression is evidenced by the impairment of the individual's daily activities, especially in social relationships (BLAS & KURUP, 2010).
The description of depression as a universal human experience has been recorded in ancient Egyptian papyri and in Old Testament biblical passages. Depression is one of the mental disorders with the best characterization throughout history, presenting descriptions remarkably consistent over 2,500 years. From the texts of Ancient Greece to the Modern Era, dominated by classifications based on operational criteria, deep sadness and its variants (hopelessness, discouragement, feeling of emptiness, grief, discouragement, despondency and despair) have been mentioned as central manifestations of depression. Likewise, related symptoms have been described, including changes in appetite and sleep, fatigue, irritability, negative thinking bias, lack of pleasure or interest in usual activities, social isolation and suicidal ideation (KENDELL, 1976).
According to Garcia (2019), depression is marked by unbearable feelings of suffering and unhappiness. People with depression have feelings of discouragement and lack of interest in life, and may have a variety of symptoms, such as loss of appetite and even changes in sleep patterns, in addition to a lack of interest in old pastimes or a deep sense of exhaustion. Many situations can lead to depression, such as loss of a loved one, heartache, marital or family problems, problems at work, job loss, financial crisis and other unexpected and unhappy situations that can affect a person's behavior and perspective of life. Depression is a serious medical problem and highly prevalent in the general population. According to epidemiological studies, the prevalence of depression throughout life in the Brazilian population is around 15.5%. The World Health Organization (WHO), the prevalence of depression in the primary health care network is 10.4%, either alone or associated with a physical disorder (Ministério da Saúde, 2020). The advance of Depression among the world population and its consequences are a constant concern of WHO. Several fronts were opened to deal with this issue, such as the Mental Health Gap Action Program (mhGAP), whose objective is “to help countries increase the services provided to people with mental, neurological and substance use disorders, through care provided by health professionals who are not specialists in mental health ”(WHO, 2018).
Getting a diagnosis of depression is not simple. Despite the current development of medicine, there are still no laboratory or complementary tests that can give an accurate diagnosis of the disease. Blood and CT scans, magnetic resonance imaging, electroencephalograms, among others, are aids in identifying other diseases, such as anemia or thyroid disorders, which can bring similar symptoms, and it is up to the doctor to differentiate the conditions .
In order to identify factors that may be relevant to a possible diagnosis of depression, the present study sought to employ machine learning techniques using data from the National Health Survey 2013, which investigated, among other topics, the existence of a diagnosis of depression . It was also sought to identify a model that was more appropriate to address this main issue.
2 LITERATURE REVIEW
2.1 DEPRESSION
Mental disorders are often associated with significant suffering or disabilities that affect social, professional or other important activities (American Psychiatric Association, 2014). They arise because of multiple factors: rapid social change, stressful working conditions, gender discrimination, social exclusion, unhealthy lifestyle, risk of violence, physical health problems and violation of human rights. There are also specific psychological and personality factors, as well as biological causes, including genetic factors, that contribute to chemical imbalances in the brain (ORGANIZAÇÃO PAN-AMERICANA DA SAÚDE. OPAS/OMS, 2016).
Depression is a brain mood disorder caused by deficiency of neurotransmitters, molecules that act on the central nervous system, considered responsible for the mood state. Its consequences are social and occupational losses, which can culminate in disability and death, since depressed mood leads to a decrease in the patient's interest or pleasure in performing activities that, before the pathology, were pleasant. Additionally, it exhibits signs and symptoms such as insomnia, sadness, damage to psychomotricity, concentration and libido, anorexia or hyperorexia, fatigue, prostration, exacerbated guilt and pessimism, indecision, recurring thoughts of death and plans for suicide (RANG ET AL., 2015; GOLAN ET AL., 2009; CYRINO ET AL., 2012). Genetic personality and inheritance are also important factors in susceptibility to developing depression (NATIONAL HEALTH SYSTEM, 2020).
There is evidence that the presence of depression increases the risk of several cardiovascular diseases, including infarction, hemorrhagic stroke and peripheral arterial disease, and it can be considered an independent factor as important as the classic risk factors for chronic diseases (DRANCOURT ET AL., 2013). In the opposite direction, depression can be a result of the disabilities and limitations that accompany chronic diseases, drawing a vicious circuit between depressive feelings and physical comorbidities (KATON ET AL., 2007).
According to the World Health Organization - WHO (2018), depression affects 340 million people today and generates serious consequences such as high rates of morbidity and mortality, the greater risk of developing cardiovascular diseases, tumors and the high rates of suicide. According to Bolsoni-Silva and Loureiro (2016), the estimate in 2020, is that the disorder reaches the mark of the second largest cause of global damage calculated for all age groups and sexes. Also according to the author, the burden of mental disorders has increased in recent years, especially in developing countries, and the global situation tends to worsen due to reasons of low investment in the area of mental health and the lack of access by people to adequate treatment.
In Brazil, it is estimated that about 12 million people suffer from depression. Therefore, one of the challenges for mental health policies in the country is to build effective strategies that assist in the treatment of mental and behavioral disorders. The promotion of mental health involves actions to create living conditions and environments that support mental health and allow people to adopt and maintain healthy lifestyles (ORGANIZAÇÃO PAN-AMERICANA DA SAÚDE. OPAS/OMS, 2016).
In terms of socioeconomic and demographic characteristics, according to WHO (2018), data on depression reveal a higher incidence in women than in men and, in extreme cases, can lead to suicide, being the second leading cause of death in population aged between 15 and 29 years. Health conditions such as the presence of chronic-degenerative diseases can lead the individual to develop depression, just as the presence of depression can also weaken the body, causing several diseases.
Baptista (1999) highlights that women tend to perceive depressive symptoms more significantly than men, in addition to the description that women seek health care more. It is also known that depression affects people of any age group. In the elderly, depression can result from biological aspects associated with frailty and comorbidities, or from psychological aspects related to widowhood, changing roles in the family and society or even social aspects related to loneliness (AMERICAN PSYCHIATRIC ASSOCIATION, 2014).
Regarding depression and diet, an individual's mental health can suffer positive or negative influences on nutrition and eating habits adopted, since both are environmental factors (TAVOLACCI ET AL. 2017). The lifestyle and eating habits have undergone changes over the years, some reports suggest the influence of modern life in the daily life of the population such as lack of time, lack of leisure, overwork, media, technological trends, among others (SOUZA ET AL., 2017).
With globalization, people have become accustomed to the sedentary lifestyle because of a remarkably busy life. This ends up leading people to wrong choices, that is, the apparently most practical foods are processed, canned, among others, considered cruel to human health (VILARTA, 2007). In addition, excessive consumption of sweets, soft drinks and processed foods is associated with the development of anxiety and depression (SILVA ET AL., 2018). A balanced diet can improve anxiety and depression, considering that the nutritional factor associated with physical activities and professional monitoring can provide an efficient and comprehensive treatment (SEZINI ET AL., 2014).
Several studies have sought to assess the relationship between food and mental health. As Rodrigues (2015) explains, food has an essential role in the individual's life and in the prevention of diseases. In fact, healthy eating patterns imply the prevention of depression, just as depressive symptoms can be influenced by eating and behavioral habits related to your lifestyle.
Gonçalves et al. (2017) sought to portray functional food as a support for a better prognosis of depression and concluded that nutrition can contribute to mental health. The authors demonstrate that a balanced diet helps to combat and treat depression, reducing the presence of symptoms of the disease, increasing good mood and the feeling of satiety.
The interaction of pet animals with humans has shown positive effects on several aspects, such as verbal interaction and socialization, social and cardiovascular well-being through companionship and distraction, in addition to alleviating the feeling of loneliness (BANKS ET AL., 2008; KRAUSE-PARELLO AND KOLASSA, 2016). According to Costa (2006), pets provide an improvement in the quality of life for people, in the sense that they bring states of happiness, reduce feelings of loneliness and help in improving physical and psychological conditions. The presence of the pet in the home can also encourage sedentary and obese people to exercise (TATIBANA & COSTA-VAL, 2009).
Another aspect is the influence of Religiosity / Spirituality (R / S) on mental health by providing resources for coping with stressful situations, providing meaning and purpose for the occurrence of these events, increasing the levels of serotonin and dopamine and, consequently, reducing the probability of depression and anxiety (KOENIG, 2012; PEREIRA & HOLANDA, 2016; LIMA ET AL., 2004).
Finally, it is noteworthy that clinical challenges include a difficult and often time-consuming diagnostic differentiation in identifying the type of depression, since the disorders may initially present, with characteristics of Bipolar Disorder (BD) together with manifestations of Major Depressive Disorder (MDD). Accurate diagnosis and appropriate treatment can take 6 to 8 years, especially when it comes to younger people (POST ET AL., 2010; BSCHOR ET AL., 2012; DRANCOURT ET AL., 2013; TONDO ET AL., 2014). Depression is initially considered as unipolar MDD in up to 40% of patients later diagnosed with BD (STENSLAND ET AL., 2008; SHEN ET AL., 2018). This uncertainty is greater, too, because depression is the most prevalent polarity in TB (BALDESSARINI ET AL., 2014; YILDIZ ET AL., 2015). In fact, it appears that the type of depression BD can be anticipated by initial episodes of anxiety or mixed states, in concomitance with common depression (BALDESSARINI ET AL., 2012, 2014, 2020).
2.2 NATIONAL HEALTH SURVEY 2013 (PNS)
Research in the health field constitutes an important subsidy to understand the reality of the health conditions of a population, allowing the development of public or private policies. In this sense, the National Health Survey 2013 - PNS 2013: Perception of health status, lifestyles and chronic diseases - was the result of a partnership between the Brazilian Institute of Geography and Statistics (IBGE) and the Ministry of Health, with the objective of "characterizing the health situation and lifestyles of the Brazilian population, as well as the attention to their health regarding access and use of services, preventive actions, continuity of care and financing of assistance" (DAMASCENA ET AL., 2015).
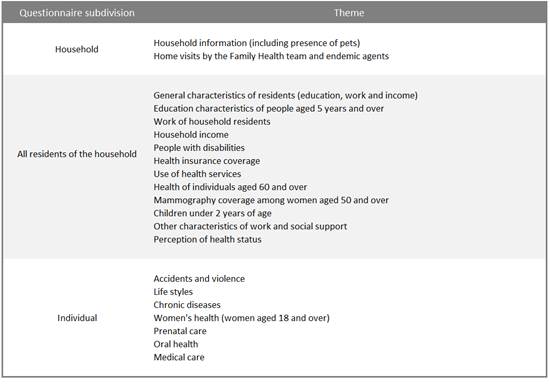
PNS 2013 is a nationwide survey, consisting of three questionnaires, one of which is home based, regarding the characteristics of the home; another related to all residents of the household; and an individual questionnaire, answered by a resident aged 18 or over, selected with equiprobability among all eligible residents, focusing on the main chronic non-communicable diseases, lifestyles and access to medical care (IBGE, 2014) . For the purposes of this study, the variables or attributes of respondents to the individual questionnaire were used, with the medical diagnosis of depression as the response variable. It is worth mentioning that, for each respondent, the variables of the first two types of questionnaire are present. Also noteworthy was the collection of physical measures by the respondent to the individual questionnaire, such as weight, height, waist circumference and blood pressure (IBGE, 2014).
According to the survey results, 7.6% of the people aged 18 and over interviewed were diagnosed with depression, with a greater predominance in the urban area than in the rural area, with percentages of 8.0% and 5.6% respectively. A higher percentage of depression was observed among females (10.9%) than among males (3.9%), as well as for people aged 60 to 64 years (11.1 %). In terms of education, the extremes of education level had the highest percentages: people with complete higher education (8.7%) and people without education and with incomplete primary education (8.6%). Finally, the analysis by color or race indicates that the percentage of people who declared themselves white and were diagnosed with depression was 9.0%, against 6.7% for people of brown color and 5.4% for people who declared themselves black (IBGE, 2014).
For a better understanding, observe Table 1, below, which shows a subdivision of the questionnaire with some of the themes used in PNS2013.
|
Table 1 – Topics covered in the 2013 National Health Survey questionnaire. |
|
|
|
Source: IBGE, 2015. National Health Survey 2013. |
2.3 MACHINE LEARNING
With the advent of Big Data and the need to extract information from large volumes of data and find patterns that help in solving problems, the use of Machine Learning tools has become increasingly common. Machine learning techniques fill the gap left when the complexity required by the data exceeds the ability of the human programmer to specify how tasks should be performed to obtain an optimal result. Machine learning, as the term itself denotes, consists of teaching or refining machine skills based on specific instructions (SHALEV-SHWARTZ & SHAI, 2014).
In supervised learning, there is a response variable for which you want to make a type of forecast or classification based on other variables present in the database. In this case, the database used for the training already contains the response variable and possible characteristics associated with it. It stands out as one of the best-known techniques for supervised regression learning, whether linear or logistical. In the case of unsupervised machine learning, the machine must perceive patterns between certain variables on its own and, through these, learn an associative rule. Unsupervised learning is useful when looking for a simpler association between variables.
In the case of the present study, the type of machine learning adopted is supervised and the method chosen is logistic regression, which will be described below.
2.4 LOGISTIC REGRESSION
The logistic regression model is a multivariate analysis technique used when it is intended to predict the probability that a given event will occur, given a set of explanatory variables associated with it. It is worth mentioning that, by estimating the probability of the response variable in view of a combination of independent variables, the results obtained are contained in the range of zero to one, inclusive. This technique uses direct statistical tests, abilities to incorporate non-linear effects and different types of diagnoses (CAMARGOS ET AL., 2012; BARRETO, 2011; HAIR JR ET AL., 2009).
Grus (2019) defines logistic regression as one of the most well-known and used machine learning algorithms today, which deals with classification problems and can be used in different areas. This type of machine learning algorithm considers different aspects or variables of an object and then determines the class in which it fits best.
A particularity of this type of model is the binary logistic regression, which allows to study situations in which the response variable is binary or dichotomous, that is, a random experiment composed of n independent repetitions of a dichotomous event. In this case, the experiment leads to only two possible results, being 0 (failure) or 1 (success) or 0 may be the absence of a certain condition or characteristic and 1 the presence. Thus, it is said that this experiment is of a binary nature. And therefore, given that the response variable Y assumes only two possible states (0 or 1), and that there is a set of p independent variables (X1, X2, ..., Xp), the equation of the logistic regression model binary, where the interest is the success or presence of a certain condition or characteristic, can be written as follows:
|
|
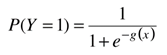
Considering that g (x) = B0 + B1X1 + B2X2 + ... + BpXp, and the coefficients B0, B1, ..., Bp are the model parameters, estimated from the data set, using the maximum likelihood method[6] (FÁVERO & BELFIORE, 2017).
In terms of the classification rule of the binary logistic regression model for the discrimination of two distinct groups, it is necessary to determine a cutoff point or classification cutoff, represented by C, with values between 0 and 1. The cutoff point will be such that , for probability values of Y greater than C, Y is classified as 1 (success or presence of the condition or characteristic) and, consequently, for values less than C, Y is classified as 0 (failure or absence of the condition or feature). Although, to establish a cutoff value, it would be interesting to know a priori the probability of occurrence of the condition or study characteristic, the common value used is 0.5 (HOSMER, LEMESHOW & STURDIVANT, 2013).
Finally, in order to obtain a good estimate of the classification efficiency of the logistic regression model, it is recommended to separate the sample into two parts, the first being for the estimation of the model and the second, to test the efficiency of the classification (HAIR JR ET AL., 2009).
In view of the above, the choice of the binary logistic regression technique as the machine learning algorithm for this article is ratified, since its objective is to classify people who suffer or not from depression based on demographic, socioeconomic and social characteristics health-related conditions and behaviors based on the 2013 National Health Survey.
3 METHODOLOGY
For a better development of the present work, the phases of Data Understanding, Data Preparation, Modeling and Evaluation were adopted, as shown in the Cross Industry Standard Process for Data Mining or CRISP-DM (SHEARER, 2000) methodology.
3.1 UNDERSTANDING THE DATA
The data understanding phase allows you to explore the data in more detail, determining the quality of the database and avoiding possible problems in the later phases (IBM, 2016). The bases used to verify the initial hypothesis - which social, economic and health conditions factors can trigger the diagnosis of depression in an individual - were related to the occurrence of the National Health Survey in 2013. As the PNS 2013 data is divided into two bases, home and person, data extraction and joining was done using the Statistical Analysis System (SAS) software, using the input made available with the microdata. After extraction, people aged 18 years or older who answered the individual questionnaire were selected. Thus, the initial base was composed of 64,308 records and 841 attributes that could, in principle, be of interest to the work.
The medical diagnosis of depression was identified as the response variable, therefore, what is expected to be verified is how the other research variables contribute or not to an individual being diagnosed with depression. For this, there was a correlation between the response variable and each explanatory variable. However, as one of the objectives of the study is to compare the efficiency of the choices of explanatory variables that will remain in the final model made by a researcher in the face of the choices resulting from machine learning, in this phase there was no exclusion of any variable.
3.2 DATA PREPARATION
In terms of data preparation, with regard to missing data, through the total number of records available in the database and the non-alteration of the final distribution of attributes when removing records with missing information, the option was made to remove the record integer when there was missing in at least one attribute. Thus, 7,229 records were removed from the database.
The next step was to check for missing variables. For this, the software Statistical Package for the Social Sciences - SPSS was used. In this phase, the following attributes were eliminated from the study: income; Daily Life Activity (ADL); all attributes related to hospital admissions; violence or aggression by an unknown or known person; current weight and weight at 20 years; height; and condition in occupation.
During data preparation, it was necessary to create new attributes from existing ones, with the necessary recoding to transform the attributes into dummy variables. After this recoding, the final basis of the PNS 2013 for this study is a file called pns.csv, composed of 57,079 records and 126 attributes, 6 of which are related to the control and recording of records. It is worth mentioning that the response variable, diagnosis of depression, was recoded into a binary variable, where the value “0” means “absence of a diagnosis of depression” and “1” means the presence of a diagnosis of depression.
3.3 MODELING
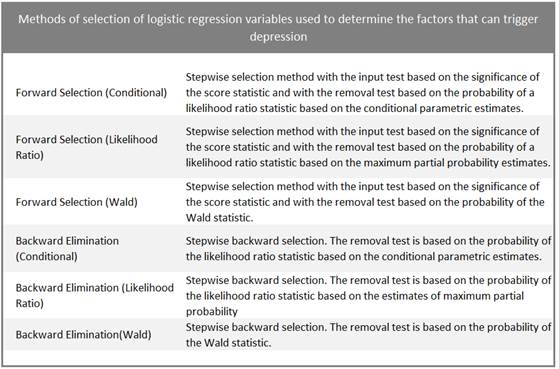
The next step was to apply the binary logistic regression model to the database. The decisions to remove or maintain each explanatory variable by the researcher were based on the observation of the significant coefficients for the model. Both the initial model and the model chosen by the researcher is the “Enter” or Insert model, in which all variables are inserted in a single step, with the difference that the researcher will choose to remove some explanatory variables according to his own criteria, based on literature on logistic regression. Characterizing machine learning, progressive and regressive methods of variable selection were used, without the user specifying inclusion and exclusion criteria, except for the cutoff point (0.5). Table 2 below illustrates the methods for selecting variables in logistic regression.
|
Table 2 - Methods for selecting variables in logistic regression |
|
|
|
Source: IBM 2016. IBM SPSS version 24.0. |
It is worth mentioning that, to equal the conditions of the study, both the researcher and the machine learning exercise used the same computer, a notebook with Intel® Core TM® I7-6700 CPU @ 3.40 GHz, 16.0GB RAM, 64-bit Operating System, x64-based processor, with Windows 10 Pro Operating System.
3.4 MODEL MADE BY THE RESEARCHER
In the Enter model chosen by the researcher, all variables are inserted into the model at once and the defined rule is to remove the explanatory variables whose coefficients were not significant for the model, considering a p-value[7] above 0.05.
According to this criterion, in the first round, 77 explanatory variables came out of the model. A second round was held, which resulted in the withdrawal of 5 variables.
Finally, in the third round, all coefficients were significant, with p-values below 0.05, thus reaching the final model, with 40 explanatory variables. The total time for defining the final model was about 33 minutes or 1.980 seconds.
3.5 MODELS WITH PROGRESSIVE AND REGRESSIVE METHODS OF SELECTION OF VARIABLES
The six methods described in Table 2 were performed. In view of the percentage of approximately 8.0% of respondents diagnosed with depression, that is, a characteristic considered rare, it was decided not to separate the sample in two parts, for estimation and classification efficiency test.
The first method was the Foward Conditional, which reached the final model in 52 steps, with a total processing time of 75.03 seconds. The final model found presented 52 explanatory variables. However, it was observed that the coefficient of the variable referring to the existence of fish as a household pet presented a p-value of 0.261, which is higher than that established as acceptable (0.05), as well as the variable relationship with the person responsible for the household is a grandfather or grandmother (0.055).
The next method was the Foward LR (Likelihood Ratio), which, like the previous one, generated a final model in 52 steps; however, the total processing time was 1670.6 seconds. There were selected 52 explanatory variables and, like the previous one, two variables were found whose coefficients had a p-value greater than 0.05, with the existence of fish as the household pet and the relationship with the person in charge of the household grandfather or grandmother, with 0.261 and 0.055, respectively.
The Foward Wald method generated a model in 46 steps, in a total time of 52.5 seconds. The model was composed of 46 explanatory variables and only the variable referring to the existence of fish as a household pet presented a coefficient with a p-value greater than the maximum acceptable (0.257).
The method applied below was the Backward Conditional, which generated a model in 59 steps, with 64 explanatory variables, in 225.1 seconds. This method generated the largest number of variables with coefficients with a p-value greater than 0.05, namely: existence of fish as a household pet (0.257); being the son of the guardian and the spouse (0.065); having friends with whom you feel comfortable and can talk about almost everything (0.107); mobility difficulties (0.096); intake of vegetables at least once a week (0.054); salt intake (0.090) and normal BMI[8] (0.067).
The Backward LR (Likelihood Ratio) method showed a longer execution time than the other methods, 1,885.3 seconds, generating a 60-step model, with 64 explanatory variables. Regarding coefficients with a p-value greater than 0.05, the following variables were observed: domicile located in the Capital of the Federation Unit (0.051); existence of fish as a household pet (0.272); total household residents (0.068); being the son of the guardian and the spouse (0.058); having friends with whom you feel comfortable and can talk about almost everything (0.107); locomotion difficulty (0.106); degree of difficulty in eating because of problems with teeth or dentures (0.064) and normal BMI (0.060).
Finally, the Backward Wald method was applied, which generated a model in 190.6 seconds and 62 steps. The model had 63 explanatory variables, and coefficients with a p-value greater than 0.05 were found for the following variables: existence of cars in the household (0.079), existence of fish as a household pet (0.257); being the son of the guardian and the spouse (0.062); education level (0.052); difficulty in walking (0.097),
intake of vegetables at least once a week (0.054), salt intake (0.090) and normal BMI (0.065).
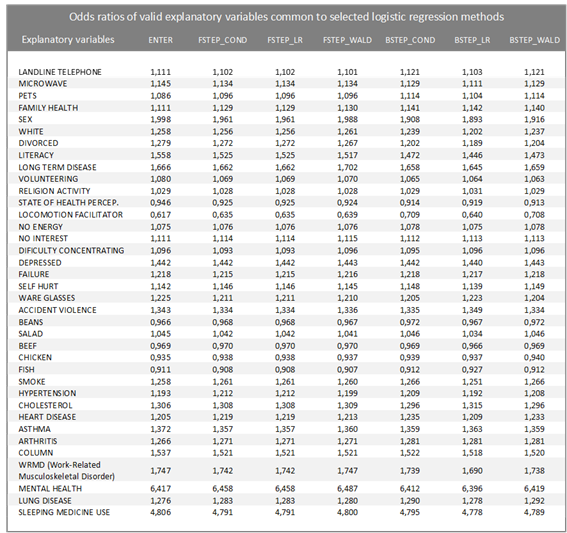
Table 3 below illustrates the 37 valid explanatory variables, that is, whose coefficients have a p-value less than 0.05, common to all models and the odds ratio (Odds Ratio) associated with them. Odds Ratio or Odds Ratio is a measure of effect that allows you to assess the chance of an event occurring in one group compared to another group. When the odds ratio is equal to 1, the occurrence of the event is equiprobable in both groups. An odds ratio greater than 1 indicates that the event is more likely to occur in the first group. And finally, if this ratio is less than 1, the probability that the event will occur is less for the first group compared to the second. It is observed that the values found for the odds ratios for these explanatory variables suffer little variation between the models, demonstrating consistency in the results.
Among the results found, it is highlighted that, for all models found, having a diagnosis of mental illness, such as schizophrenia, bipolar disorder, psychosis or OCD (obsessive compulsive disorder) increases, on average, 6.4 times the chance of the individual have a diagnosis of depression. Likewise, those individuals who responded that they had used some sleeping medication in the past two weeks are, on average, 4.8 times more likely to be diagnosed with depression. It is also observed that presenting any of the following conditions contributes to a reduction in the chance of being diagnosed with depression: using some resource such as a cane, crutch, wheelchair, walker or other equipment to aid mobility; fish consumption; chicken consumption; bean consumption; and have a good perception of your health status.
|
Table 3 - Odds ratios of valid explanatory variables common to selected logistic regression methods |
|
|
3.6 EVALUATION
The performance evaluation of different logistic regression models is done by comparing some metrics such as Cox-Snell R2 and Nagelkerke R2, in addition to precision, which is the proportion of values correctly classified by each model. Table 4 below illustrates a comparison between the results of these metrics. It was observed that the values of these metrics were similar for all models, with emphasis on the Backward LR model, whose values were slightly higher than the others. However, this model also had the longest processing time.
|
Table 4 – Metrics for evaluating the performance of selected logistic regression models |
|
|
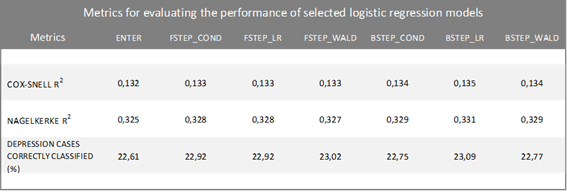
The models above proved to be good for classifying those who are not diagnosed with depression, with a percentage of correct answers above 95.0%. However, they are not efficient to correctly classify individuals diagnosed with depression. This finding can be attributed to the fact that depression is a rare characteristic in the study population.
4 RESULTS IMPLEMENTATION
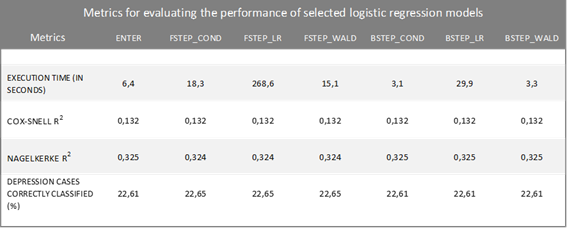
Considering the results obtained in the previous topic, the researcher chose to test a logistic regression model using only the 37 variables common to all models. The previous seven types of models were executed; however, for the Enter type model, there was no interference from the researcher. Table 5 below illustrates the performance evaluation among the models obtained. The results indicate that there was no improvement in the performance of the models, except for the processing time, which would be expected since the number of explanatory variables was less than in the initial models.
|
Table 5 – Metrics for evaluating the performance of selected logistic regression models |
|
|
5 FINAL CONSIDERATIONS AND RECOMMENDATION FOR FUTURE STUDIES
The present study consisted of applying machine learning techniques to data from the National Health Survey 2013, with a focus on logistic regression, aiming to identify factors that could cause depression. The results indicated 37 independent variables, some of which could increase the chances of a positive diagnosis of depression, with emphasis on the diagnosis of mental illness, such as schizophrenia, bipolar disorder, psychosis or OCD (Obsessive compulsive disorder) and having used some sleeping medication in the last two weeks prior to the research reference date. On the other hand, the consumption of certain foods, such as fish, chicken and beans, seems to reduce the chances of this diagnosis.
In terms of machine learning, the application of six logistic regression methods without interference from the researcher in the data, proved to be successful in that it allowed selecting common variables to compose a final model. However, in all models, variables were selected that would be eliminated from the model if the rule indicated that all logistic regression coefficients should be significant, that is, their associated p-values should be less than the level of significance commonly used of 0.05.
The performance of the models proved to be similar when the Cox-Snell R2 and Nagelkerke R2 metrics were compared, however, there were differences in the processing time of each model.
Given the proportion of people diagnosed with depression in the study population being around 7.6%, it can be said that this characteristic is rare for this population.
It is intended, in future works, to opt for a multinomial regression, creating the dependent variable with multiple categories from a combination of depression diagnosis and population groups, whether age or by sex; or by other models that are more suitable to the problem. There is also the possibility of replicating the study with PNS 2019 data, whose microdata will be available soon.
REFERENCES
AMERICAN PSYCHIATRIC ASSOCIATION -APA (Estados Unidos) (Org). Manual diagnóstico e estatístico de transtornos mentais: DSM-5. 5.ed. Porto Alegre: Artmed, 2014.
ANDRADE, Patrícia Marques. Depressão: Um Novo Olhar Sobre A Dor E A Emoção. BIUS-Boletim Informativo Unimotrisaúde em Sociogerontologia, v. 16, n. 10, p. 1-9, 2020.
BALDESSARINI RJ, Tondo L, Vázquez GH. Chapt 4: Unmet needs in psychiatry: bipolar depression. In: Pompili M, McIntyre RS, Fiorillo A, Sartorius N, editors. New directions in psychiatry. New York: Springer Press; 2020.
BALDESSARINI RJ, TONDO L, VISIOLI C. First-episode types in bipolar disorder: predictive associations with later illness. Acta Psychiatr Scand. 2014;129(5):383–92.
BALDESSARINI RJ, Undurraga J, Vázquez GH, et al. Predominant recurrence polarity among 928 adult international bipolar I disorder patients. Acta Psychiatr Scand. 2012;125(4):293–302.
BANKS MR, et al. Animal-assisted therapy and loneliness in nursing homes: use of robotic versus living dogs. J Am Med Dir Assoc. 2008 Mar;9(3):173-7.
BAPTISTA, M. N.; BAPTISTA, A. S. D.; DE OLIVEIRA, M. G. Depressão e Gênero: Porque as mulheres deprimem mais que os homens/ SP,1999.
BARRETO, A. S. Modelos de Regressão: Teoria e Aplicação com o Programa Estatístico R, Edição do Autor, 1 Edição, p. 109-114, Brasília, 2011.
BLAS E, Kurup AS. Equity, Social Determinants and Public Health Programs. Geneva: WHO, 2010.
BOLSONI-SILVA, A T & Loureiro, S R. O impacto das habilidades sociais para a depressão em estudantes universitários. Psicologia: teoria e pesquisa, 2016, 32(4).
BSCHOR, T., et al. "Are bipolar disorders underdiagnosed in patients with depressive episodes? Results of the multicenter BRIDGE screening study in Germany." Journal of affective disorders 142.1-3, 2012: 45-52.
CAMARGOS, M. A.; CAMARGOS, M. C. S.; ARAÚJO, E. A. A inadimplência em um programa de crédito de uma instituição financeira pública de Minas Gerais: uma análise utilizando regressão logística. REGE Revista de Gestão, v. 19, n. 3, p. 467-486, jul./set. 2012.
COSTA, E. C. Animais
de estimação: uma abordagem psico-sociológica da concepção dos idosos
(Dissertação de Mestrado em Saúde Pública). Universidade Estadual do Ceará,
Fortaleza, 2006.
https://siduece.uece.br/siduece/trabalhoAcademicoPublico.jsf?id=37415
CYRINO, LUIZ ARTHUR, Camila Safanelli, and Jéssica Karolina Rodrigues. Transtorno Afetivo Bipolar Relacionado Ao Uso Abusivo De Substâncias Psicoativas: Uma Revisão Bibliográfica. Revista Contexto & Saúde 12.23, 2012: 15-25.
DAMASCENA GN, Szwarcwald CL, Malta DC, Souza Júnior PRBD, Vieira MLFP, Pereira CA, Morais Neto OLD, Silva Júnior JBD. O processo de desenvolvimento da Pesquisa Nacional de Saúde no Brasil, 2013. Epidemiol Serv Saude 2015; 24(2):197-206.
DRANCOURT N, Etain B, Lajnef M, Henry C, Raust A, Cochet B, Mathieu F, Gard S, Mbailara K, Zanouy L, Kahn JP, Cohen RF, Wajsbrot-Elgrabli O, Leboyer M, Scott J, Bellivier F. Duration of untreated bipolar disorder: missed opportunities on the long road to optimal treatment. Acta Psychiatric Scand. 2013;127(2):136–44.
FÁVERO, Luiz Paulo Lopes; BELFIORE, Patrícia Prado. Manual de análise de dados: estatística e modelagem multivariada com Excel®, SPSS® e Stata®. Elsevier Brasil. [S.l: s.n.], 2017.
FERREIRA, J.C.; PATINO, C.M. O que realmente significa o valor-p? Jornal Brasileiro de Pneumologia, Vol. 41. Num. 5. 2015, p. 485-485.
GARCIA, Tamar. Ansiedade: Liberte-se Da Ansiedade E Da Depressão. Babelcube Inc., 2019.
GOLAN, D.E. Tashjian Junior, A. H., Armstrong, E. J., & Armstrong, A. W. Princípios de farmacologia: a base fisiopatológica da farmacoterapia. Segunda edição. Rio de Janeiro: Guanabara Koogan, (pp. xxiv-952), 2009.
GONÇALVES, Pablo Freitas, Sousa, Bruno Rafael Virginio de, Maracaja, Vitoria de Freitas, & Veiga, Dêmia Kellyani Eleoterio.. Alimentação funcional como suporte para melhor prognóstico da depressão. Anais I CONBRACIS... Congresso Brasileiro de Ciências da Saúde. Faculdade Maurício de Nassau, Campus: Unidade I, Campina Grande, Paraíba, 2016. https://www.editorarealize.com.br/index.php/artigo/visualizar/18859.
GRUS, J., Data Science from Scratch: first principals with Python, E-book Kindle. 2nd edition, ISBN 978-85-7608-998-8, p.189/200, 2019.
HAIR, Joseph F.; ANDERSON, Rolph E.; TATHAM, Ronald L.; BLACK, William C. Análise multivariada de dados. Porto Alegre: Bookman ed., 2009. Tradução da 5ª edição americana por Adonai Schlup Sant´Anna e Anselmo Chaves Neto.
HOSMER, D., LEMESHOW, S. and STURDIVANT, R.X. Applied Logistic Regression. 3rd Edition, (Vol.398) Jonh Wiley & Sons, Chichester, 2013.
IBM Corp. Released 2016. IBM SPSS Statistics for Windows, Version 24.0. Armonk, NY: IBM Corp. 2016.
INSTITUTO BRASILEIRO DE GEOGRAFIA E ESTATÍSTICA (IBGE). Pesquisa Nacional de Saúde: Percepção do estado de saúde, estilos de vida e doenças crônicas não transmissíveis. Rio de Janeiro: IBGE 2014.
KALETA D, Polańska K, Dziankowska-Zaborszczyk E, Hanke W, Drygas W. Factors influencing self-perception of health status. Cent Eur J Public Health. 2009;17(3):122-7.
KATON W, Lin EH, Kroenke K. The association of depression and anxiety with medical symptom burden in patients with chronic medical illness. Gen Hosp Psychiatry 2007;29(2):147-55. https://doi.org/10.1016/j.genhosppsych.2006.11.005 » 2006.11.005
KENDELL R E. The classification of depressions: a review of contemporary confusion. The British Journal of Psychiatry, 129, 15–28. https://doi.org/10.1192/bjp.129.1.15. 1976; 129:15-28.
KOENIG, Harold G. Religion, spirituality, and health: The research and clinical implications. ISRN psychiatry, 2012.
KRAUSE-PARELLO C A, Kolassa J. Pet Therapy: Enhancing Social and Cardiovascular Wellness in Community Dwelling Older Adults. Journal of Community Health Nursing, 2016; 33(1): 1-10.
LIMA, IVANOR VELLOSO MEIRA, Everton Botelho Sougey, and Homero Pinto Vallada Filho. Farmacogenética do tratamento da depressão: busca de marcadores moleculares de boa resposta aos antidepressivos. Archives of Clinical Psychiatry (São Paulo) 31.1, 2004: 40-43.
MINISTÉRIO DA SAÚDE. Depressão: causas, sintomas, tratamentos, diagnóstico e depressão [access on 07 jul 2020]. http://portalms.saude.gov.br/saude-de-a-z/saude-mental/depressao .
NATIONAL HEALTH SYSTEM– UK. Clinical depression – Causes [access on 07 jul 2020]. https://www.nhs.uk/conditions/clinical-depression/causes/ .
ORGANIZAÇÃO PAN-AMERICANA DA SAÚDE. OPAS/OMS apoia governos no objetivo de fortalecer e promover a saúde mental da população. Brasília, DF, 2016. Access on https://www.paho.org/bra/index.php?option=com_content&view=article&id=5263:opas-oms-apoia-governos-no-objetivo-de-fortalecer-e-promover-a-saude-mental-da-populacao&Itemid=839 14 jul. 2020.
PEREIRA, Karine & Holanda, Adriano. Espiritualidade e religiosidade para estudantes de psicologia: Ambivalências e expressões do vivido. Pistis & Praxis: Teologia e Pastoral. 8. 10.7213/revistapistispraxis.08. 002.ds07, 2016.
POST RM, Leverich GS, Kupka RW, et al. Early-onset bipolar disorder and treatment delay are risk factors for poor outcome in adulthood. J Clinic Psychiatry. 2010;71(7):864–72.
RANG, H.P. et al. Rang & Dale: farmacologia. 6. ed. Rio de Janeiro: Elsevier, 2007.
RODRIGUES, Cláudia Patrícia Canteiro. Deficiência da vitamina b12 como um fator de risco na demência do idoso. 2015. 52 f. Dissertação (Mestrado) -Curso de Medicina, Faculdade de Medicina da Universidade de Coimbra, Coimbra, 2015.
SEZINI, A. M.; DO COUTTO GIL, C. S. G. Nutrientes e depressão\ Vita et Sanitas, Trindade, v. 8, n. 1, p. 39-57, 2014.
SHALEV-SHWARTZ, Shai. Ben-David, Shai. Understanding Machine Learning: From Theory to Algorithms, Cambridge, Cambridge University Press, 2014.
SHEARER, C. The CRISP-DM model: the new blueprint for data mining. Journal of data warehousing, v. 5, n. 4, p. 13–22, 2000.
SHEN H, Zhang L, Xu C, Zhu J, Chen M, Fang Y. Analysis of misdiagnosis of bipolar disorder in an outpatient setting. Shanghai Arch Psychiatry.2018;30(2):93–101.
SILVA, R. R. Alimentação, Depressão e Ansiedade: entenda a relação\ UNIFAL, Universidade Federal de Alfenas, MG, 2018.
SOUZA, D. T. B.; LUCIO, J. M.; ARAÚJO, A. S.; BATISTA, D. A. Ansiedade e Alimentação: uma análise inter-relacional, Anais II CONBRACIS Congresso Brasileiro de Ciências da Saúde. 2017.
STENSLAND MD, Schultz JF, Frytak JR. Diagnosis of unipolar depression following initial identification of bipolar disorder: common and costly misdiagnosis. J Clin Psychiatry. 2008;69(5):749–58.
TATIBANA, Lilian Sayuri, and Adriane Pimenta da Costa-Val. Relação homem-animal de companhia e o papel do médico veterinário. Projeto De Educação Continuada. É o CRMV-MG investindo no seu potencial, 2009: 11.
TAVOLACCI MP, Grigioni S, Richard L, Meyrignac G, Déchelotte P, Ladner J. Eating disorders and associated health risks among university students. Nutrition Education and Behavior. 2015;47(5): 412-20. http://www.jneb.org/article/S1499-4046(15)00569-2/abstract. Accessed 07 Apr 2017.
TONDO L, Baldessarini RJ. Reduction of suicidal behavior in bipolar disorder patients during long-term treatment with lithium. In: Koslow SH, Ruiz P, Nemeroff CB, editors. Concise guide to understanding suicide: epidemiology pathophysiology and prevention. Cambridge: Cambridge University Press; 2014. p. 217–28.
Vilarta, R. Alimentação Saudável, Atividade Física e Qualidade de Vida. Campinas: IPES Editorial, 2007.
WORLD HEALTH ORGANIZATION – WHO. Physical status: The use of and interpretation of anthropometry, Report of a WHO Expert Committee, 2018. https://apps.who.int/iris/handle/10665/37003
YILDIZ A, Nemeroff C, Ruiz P, editors. The bipolar book: history, neurobiology, and treatment. New York: Oxford University Press; 2015.